The Online Optimism team did a stellar job making our research user-friendly, interactive, and accessible. While we are thrilled to be published, it’s just as important to be able to reach policymakers and others who can use this data to improve health inequities in their own communities. The team understood our need, executed the project within deadline, and remained flexible all the way through. We wouldn’t hesitate to work with them again.
Transforming Health Inequity Data into a Powerful Online Resource
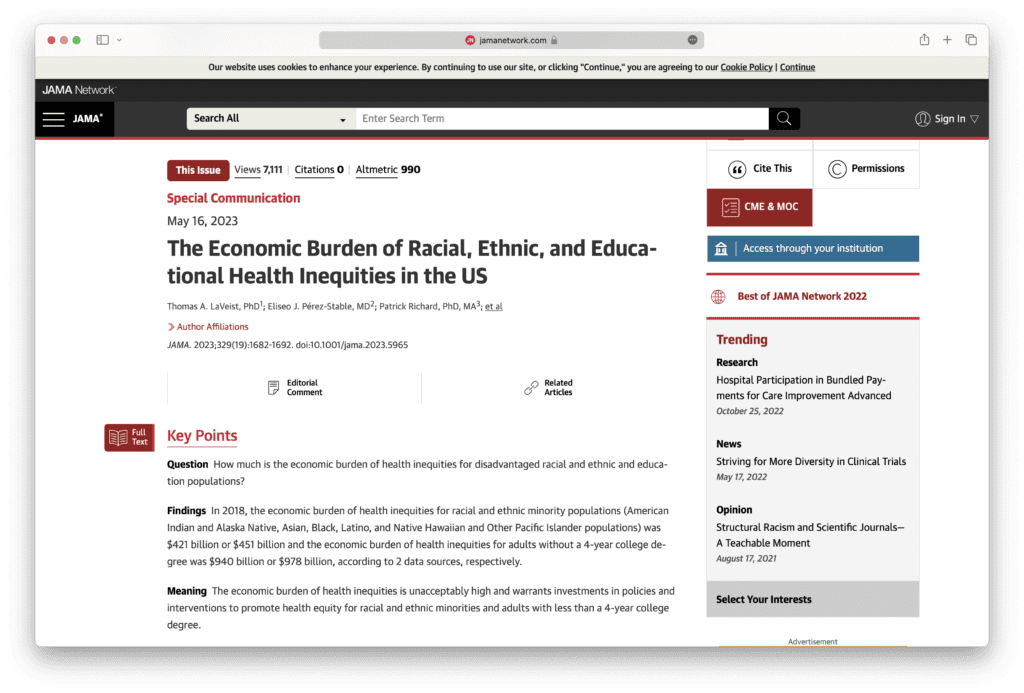
A research team led by Dr. Thomas LaVeist, the dean of the Tulane School of Public Health and Tropical Medicine, conducted a groundbreaking study analyzing the cost of racial, ethnic, and socioeconomic health inequities across the United States. The team quantified the impact of these disparities, demonstrating that they are just as deadly to the economy as they are to human life and wellbeing. The results of the study were published in the Journal of the American Medical Association (JAMA) on May 16, 2023.
The research team needed to make the data from the report easily accessible and available for researchers, activists, and policymakers online. The goal was to provide an interactive platform where users could explore the data to better understand the costs of health inequities and use this knowledge to help resolve these disparities and improve health outcomes.

Our Approach
Online Optimism took on the challenge of translating the extensive data from the report into a user-friendly, interactive website. Our team focused on three key components:

Responsive Data Visualizations
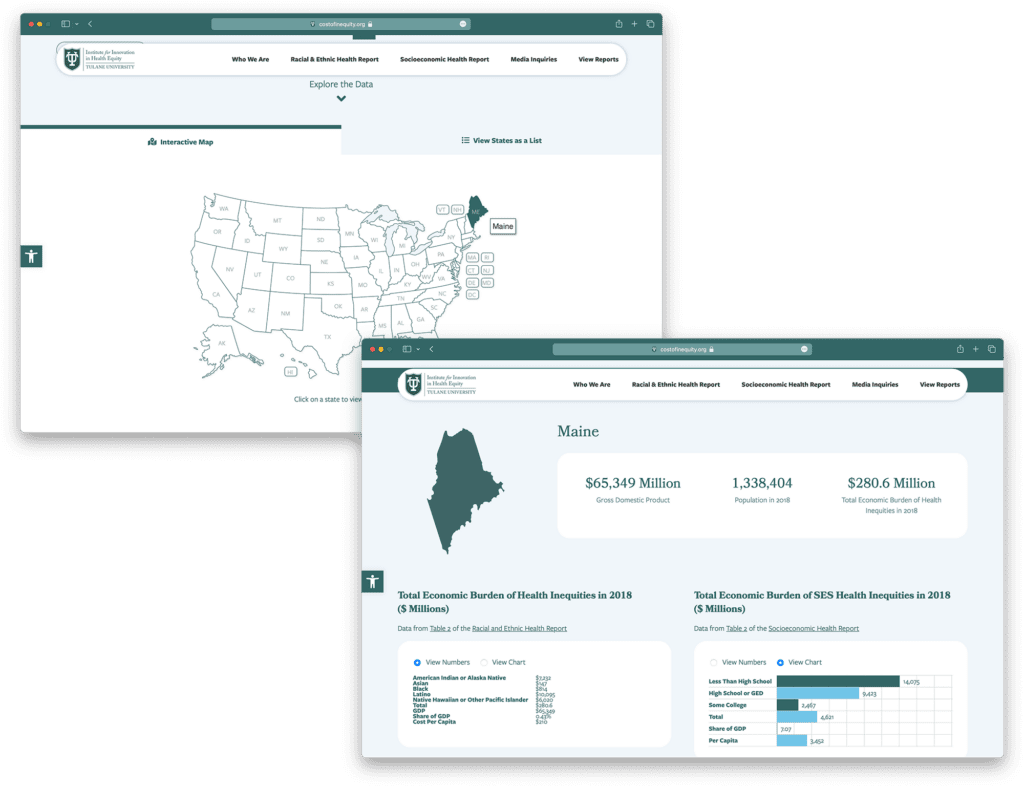
We transformed the provided data into responsive, mobile-optimized charts and tables that allowed for easy comparison across racial, ethnic, and socioeconomic demographics. This enabled users to quickly grasp the impact of health inequities on different population groups.
Interactive State Map
We developed an interactive map that allowed users to explore data across states and view all data associated with each state. This feature enabled policymakers and researchers to identify disparities and trends at the state level, providing essential information for targeted interventions.


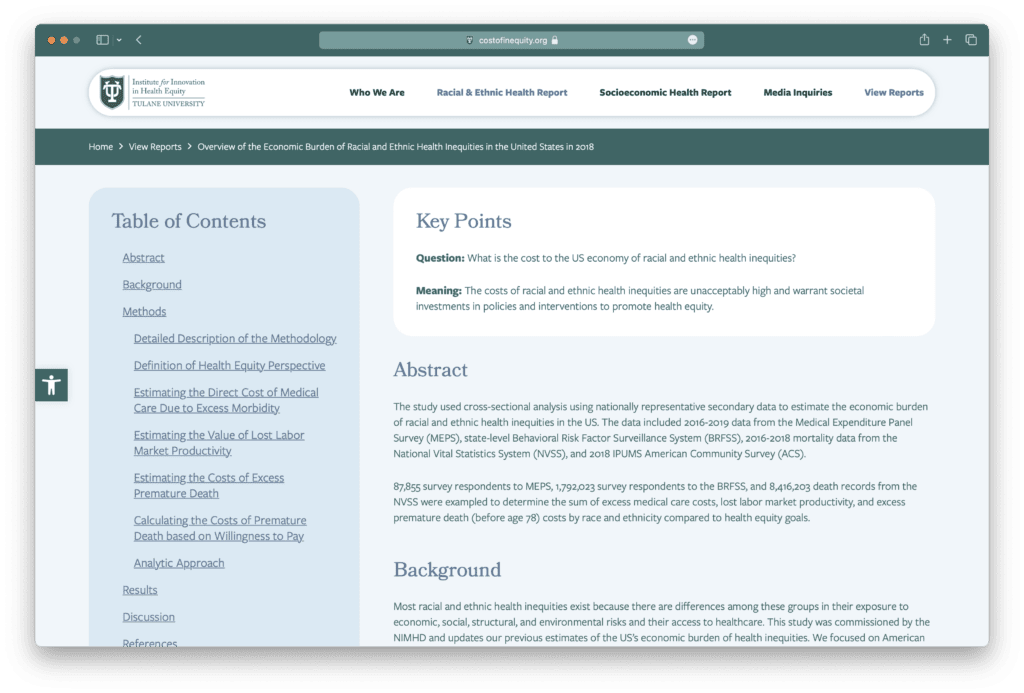
Accessible Summaries
To help orient site visitors and ensure they could quickly understand the critical findings of the report, we created summaries of the report’s primary takeaways. These summaries provided an accessible entry point for users to explore the data and understand the implications of the research.
The Results
The Cost of Inequity website successfully transformed the complex data from the initial report into an accessible, interactive online resource. The website now serves as a valuable tool for researchers, activists, and policymakers working to address and resolve health inequities in the United States.
As an easy-to-use platform for exploring the data, the website has the potential to drive meaningful change in public policy through raising awareness about the economic costs of health disparities and the urgent need for effective interventions to improve health outcomes for millions of Americans.


Want Your Company to be our
Next Case Study?
"*" indicates required fields
