Challenge
The Data Center needed to turn their reports into more easily digestible information to bring awareness of critical issues in Southeast Louisiana. They wanted to break down their highly detailed reports into social media posts to increase stakeholder awareness and engagement, but they didn’t have the internal capacity to comb through the information to make weekly posts.
Insights
The Data Center knew that their reports were written in ways that made them easy to read and understand, but that people just don’t read long reports anymore. However, they still needed to inform and engage stakeholders in their geographic regions so that they could make data-driven decisions.
Online Optimism stepped in to match their voice and standards as a neutral nonprofit, as we created posts that served their mission and were easy to understand.
Solution
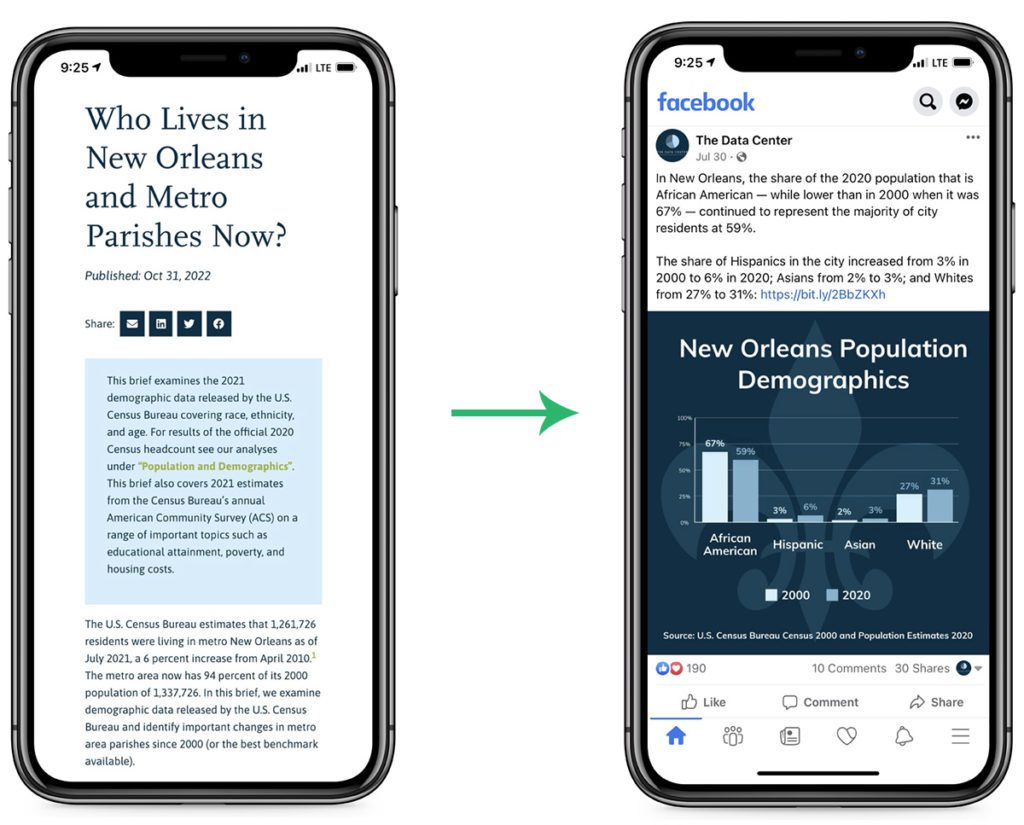
The Online Optimism team took information from The Data Center’s reports and condensed them into 38 weekly organic posts on LinkedIn, Facebook, Twitter, and Instagram. In addition, we created 3 custom graphics per week that illustrated information to pair with the social posts. Online Optimism also carried out monthly Facebook ads to drive traffic to The Data Center’s website, create awareness, and engage stakeholders.
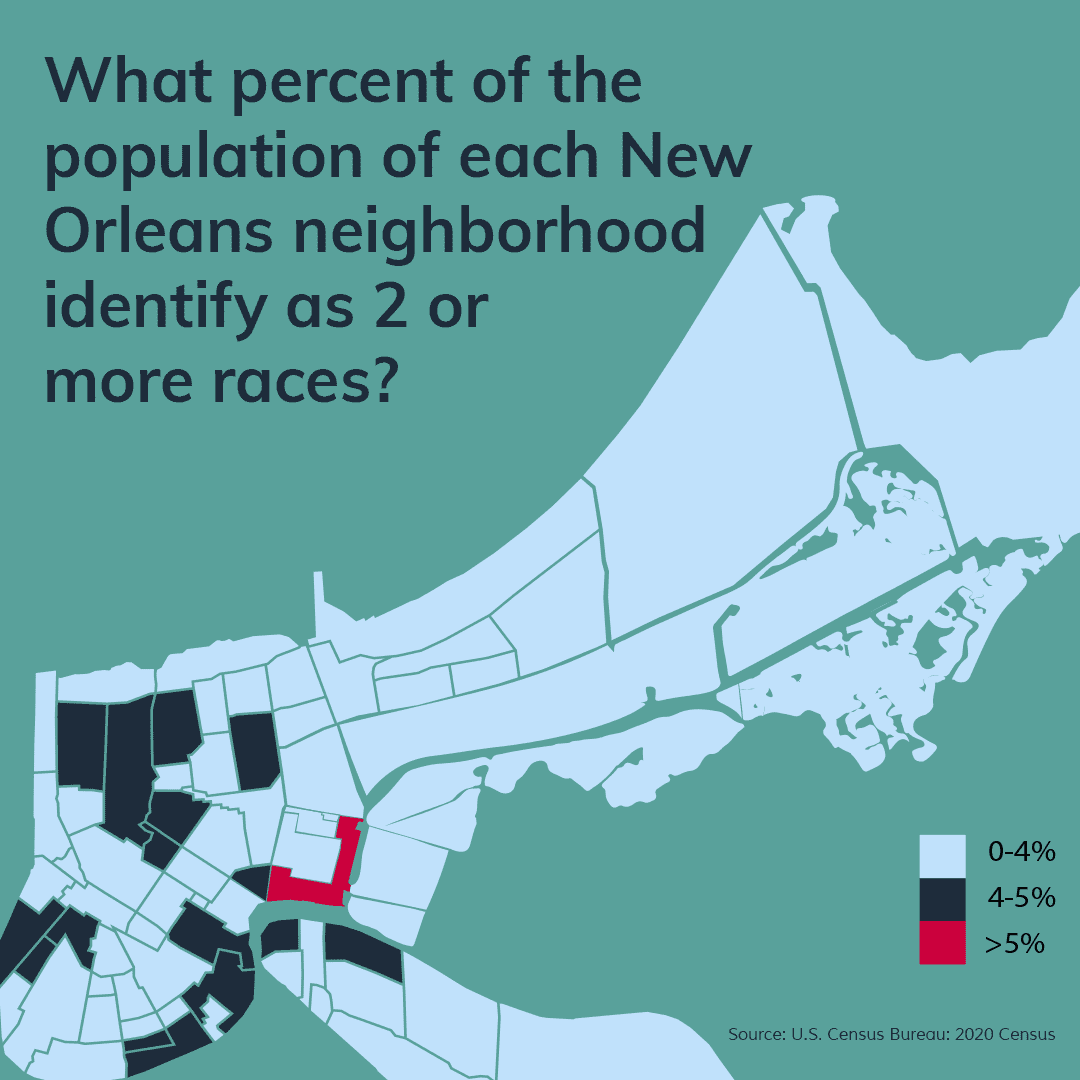
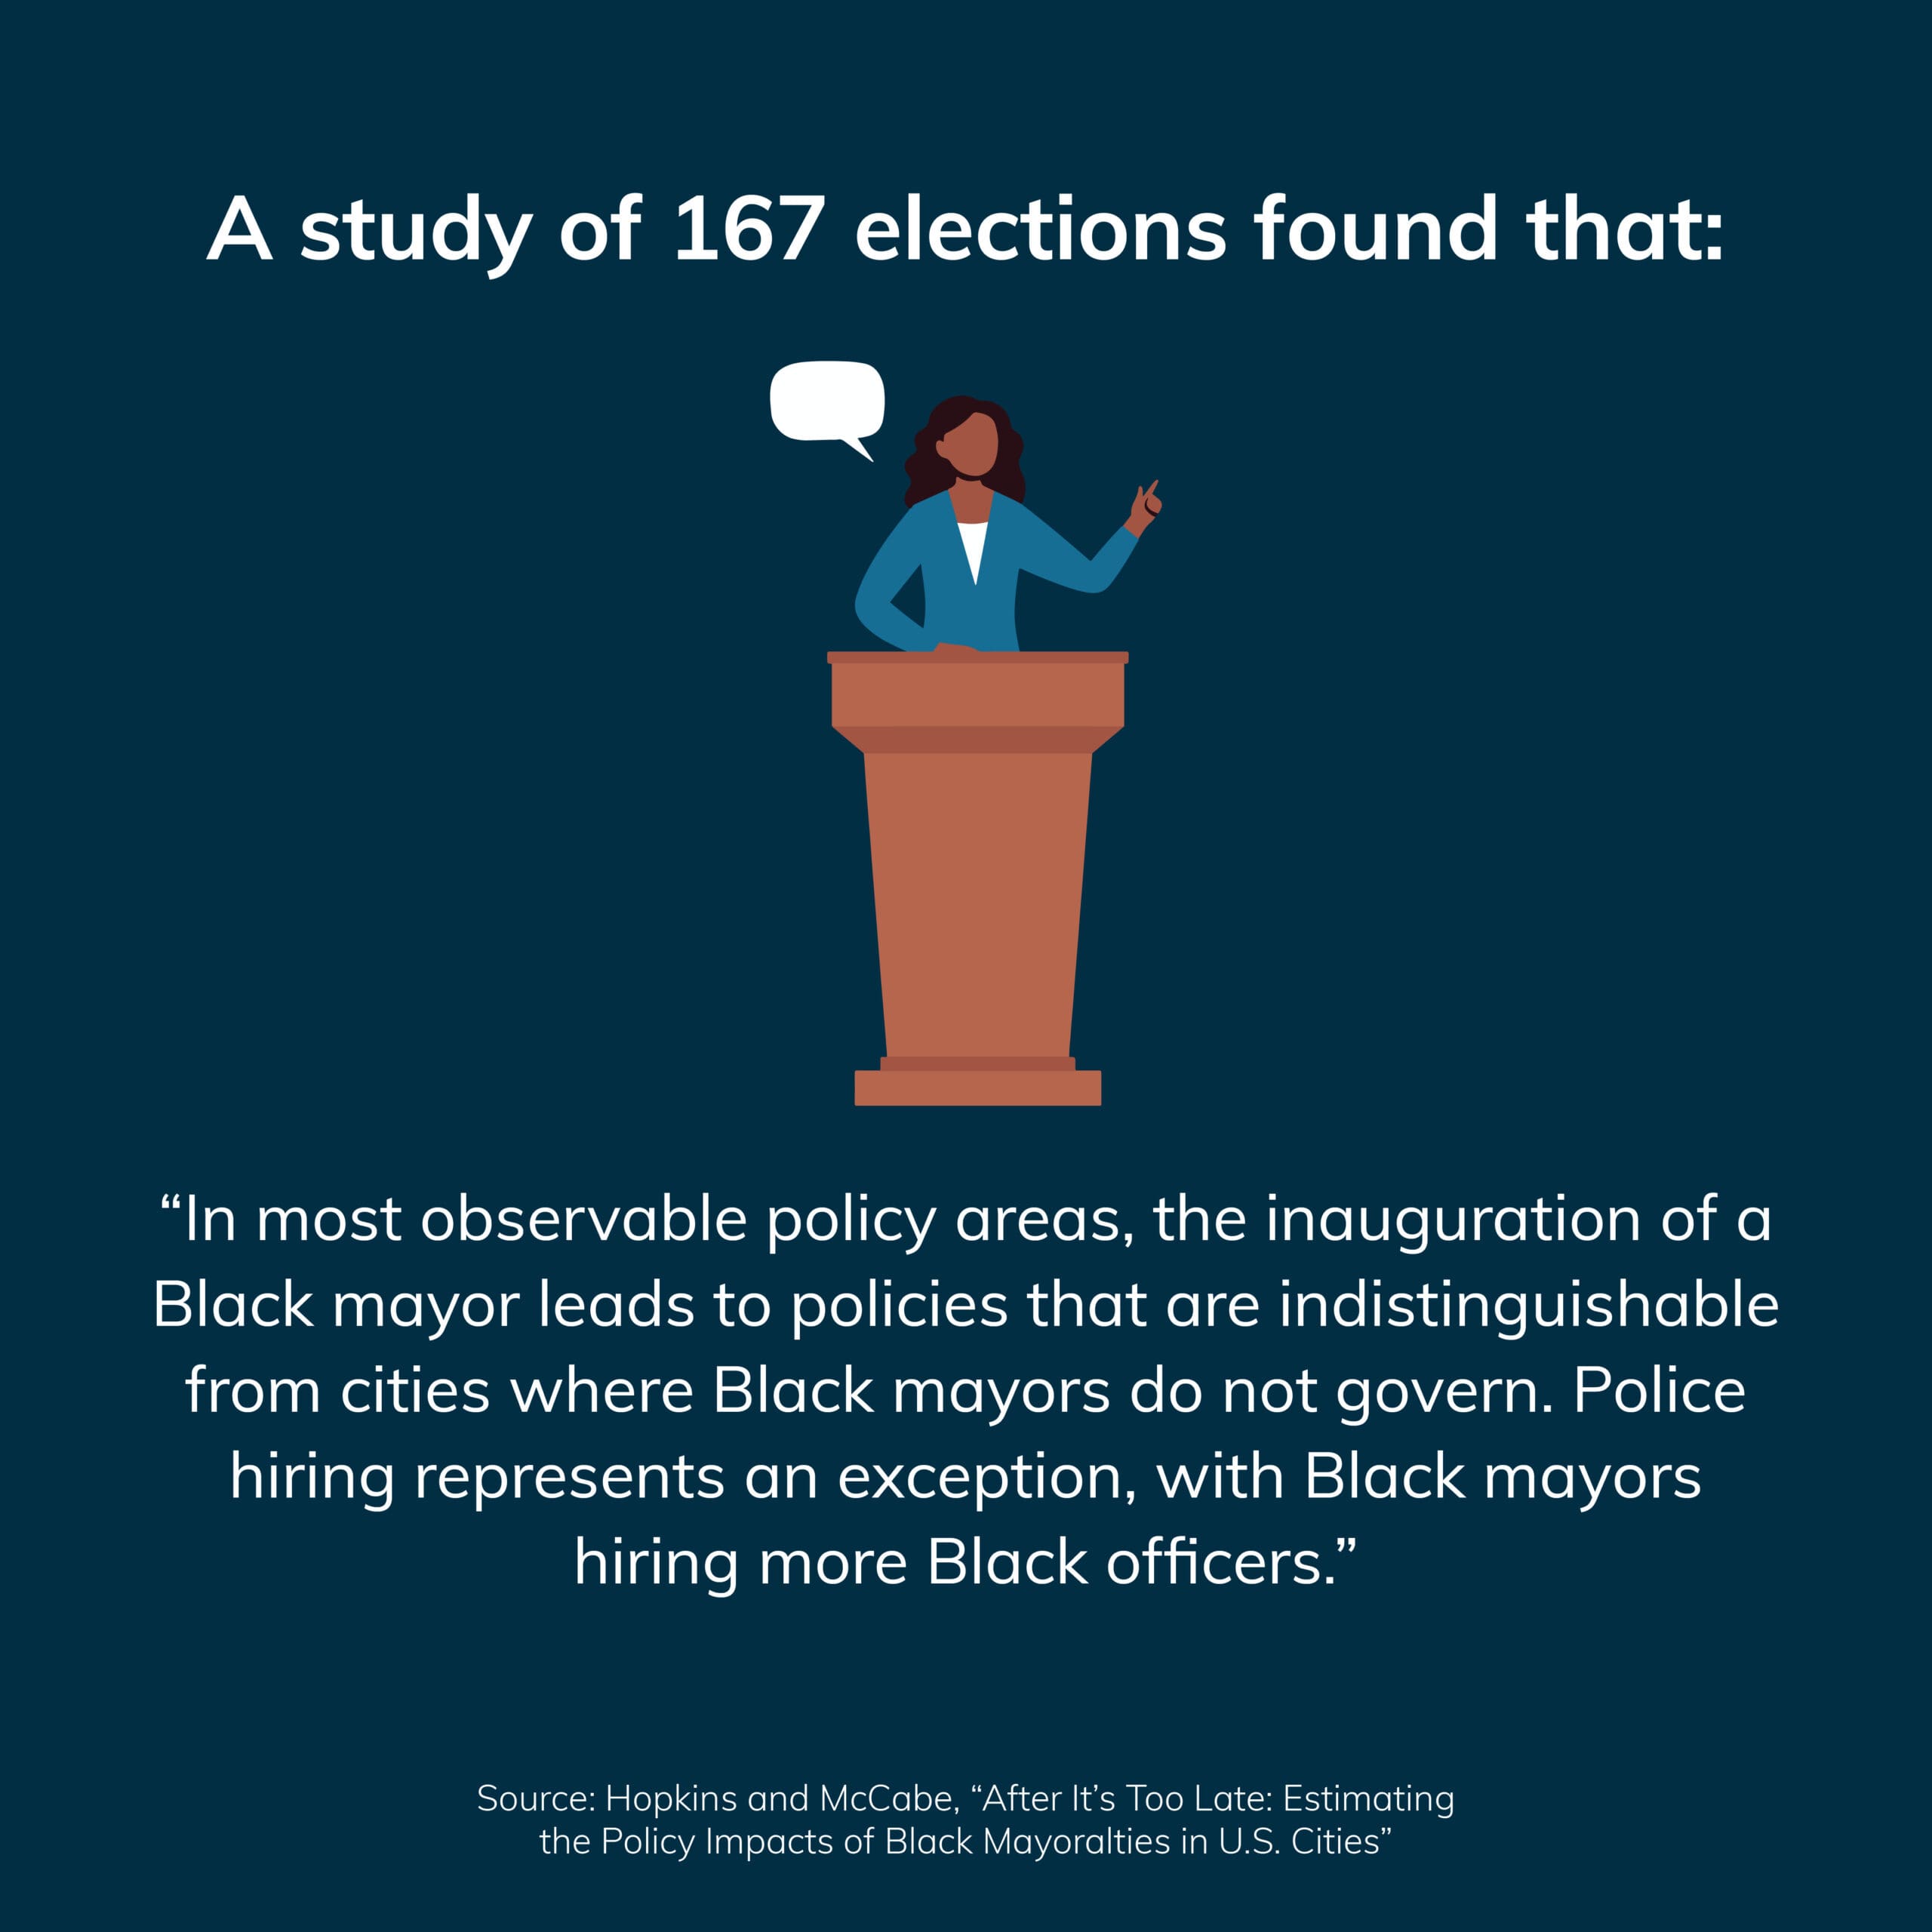
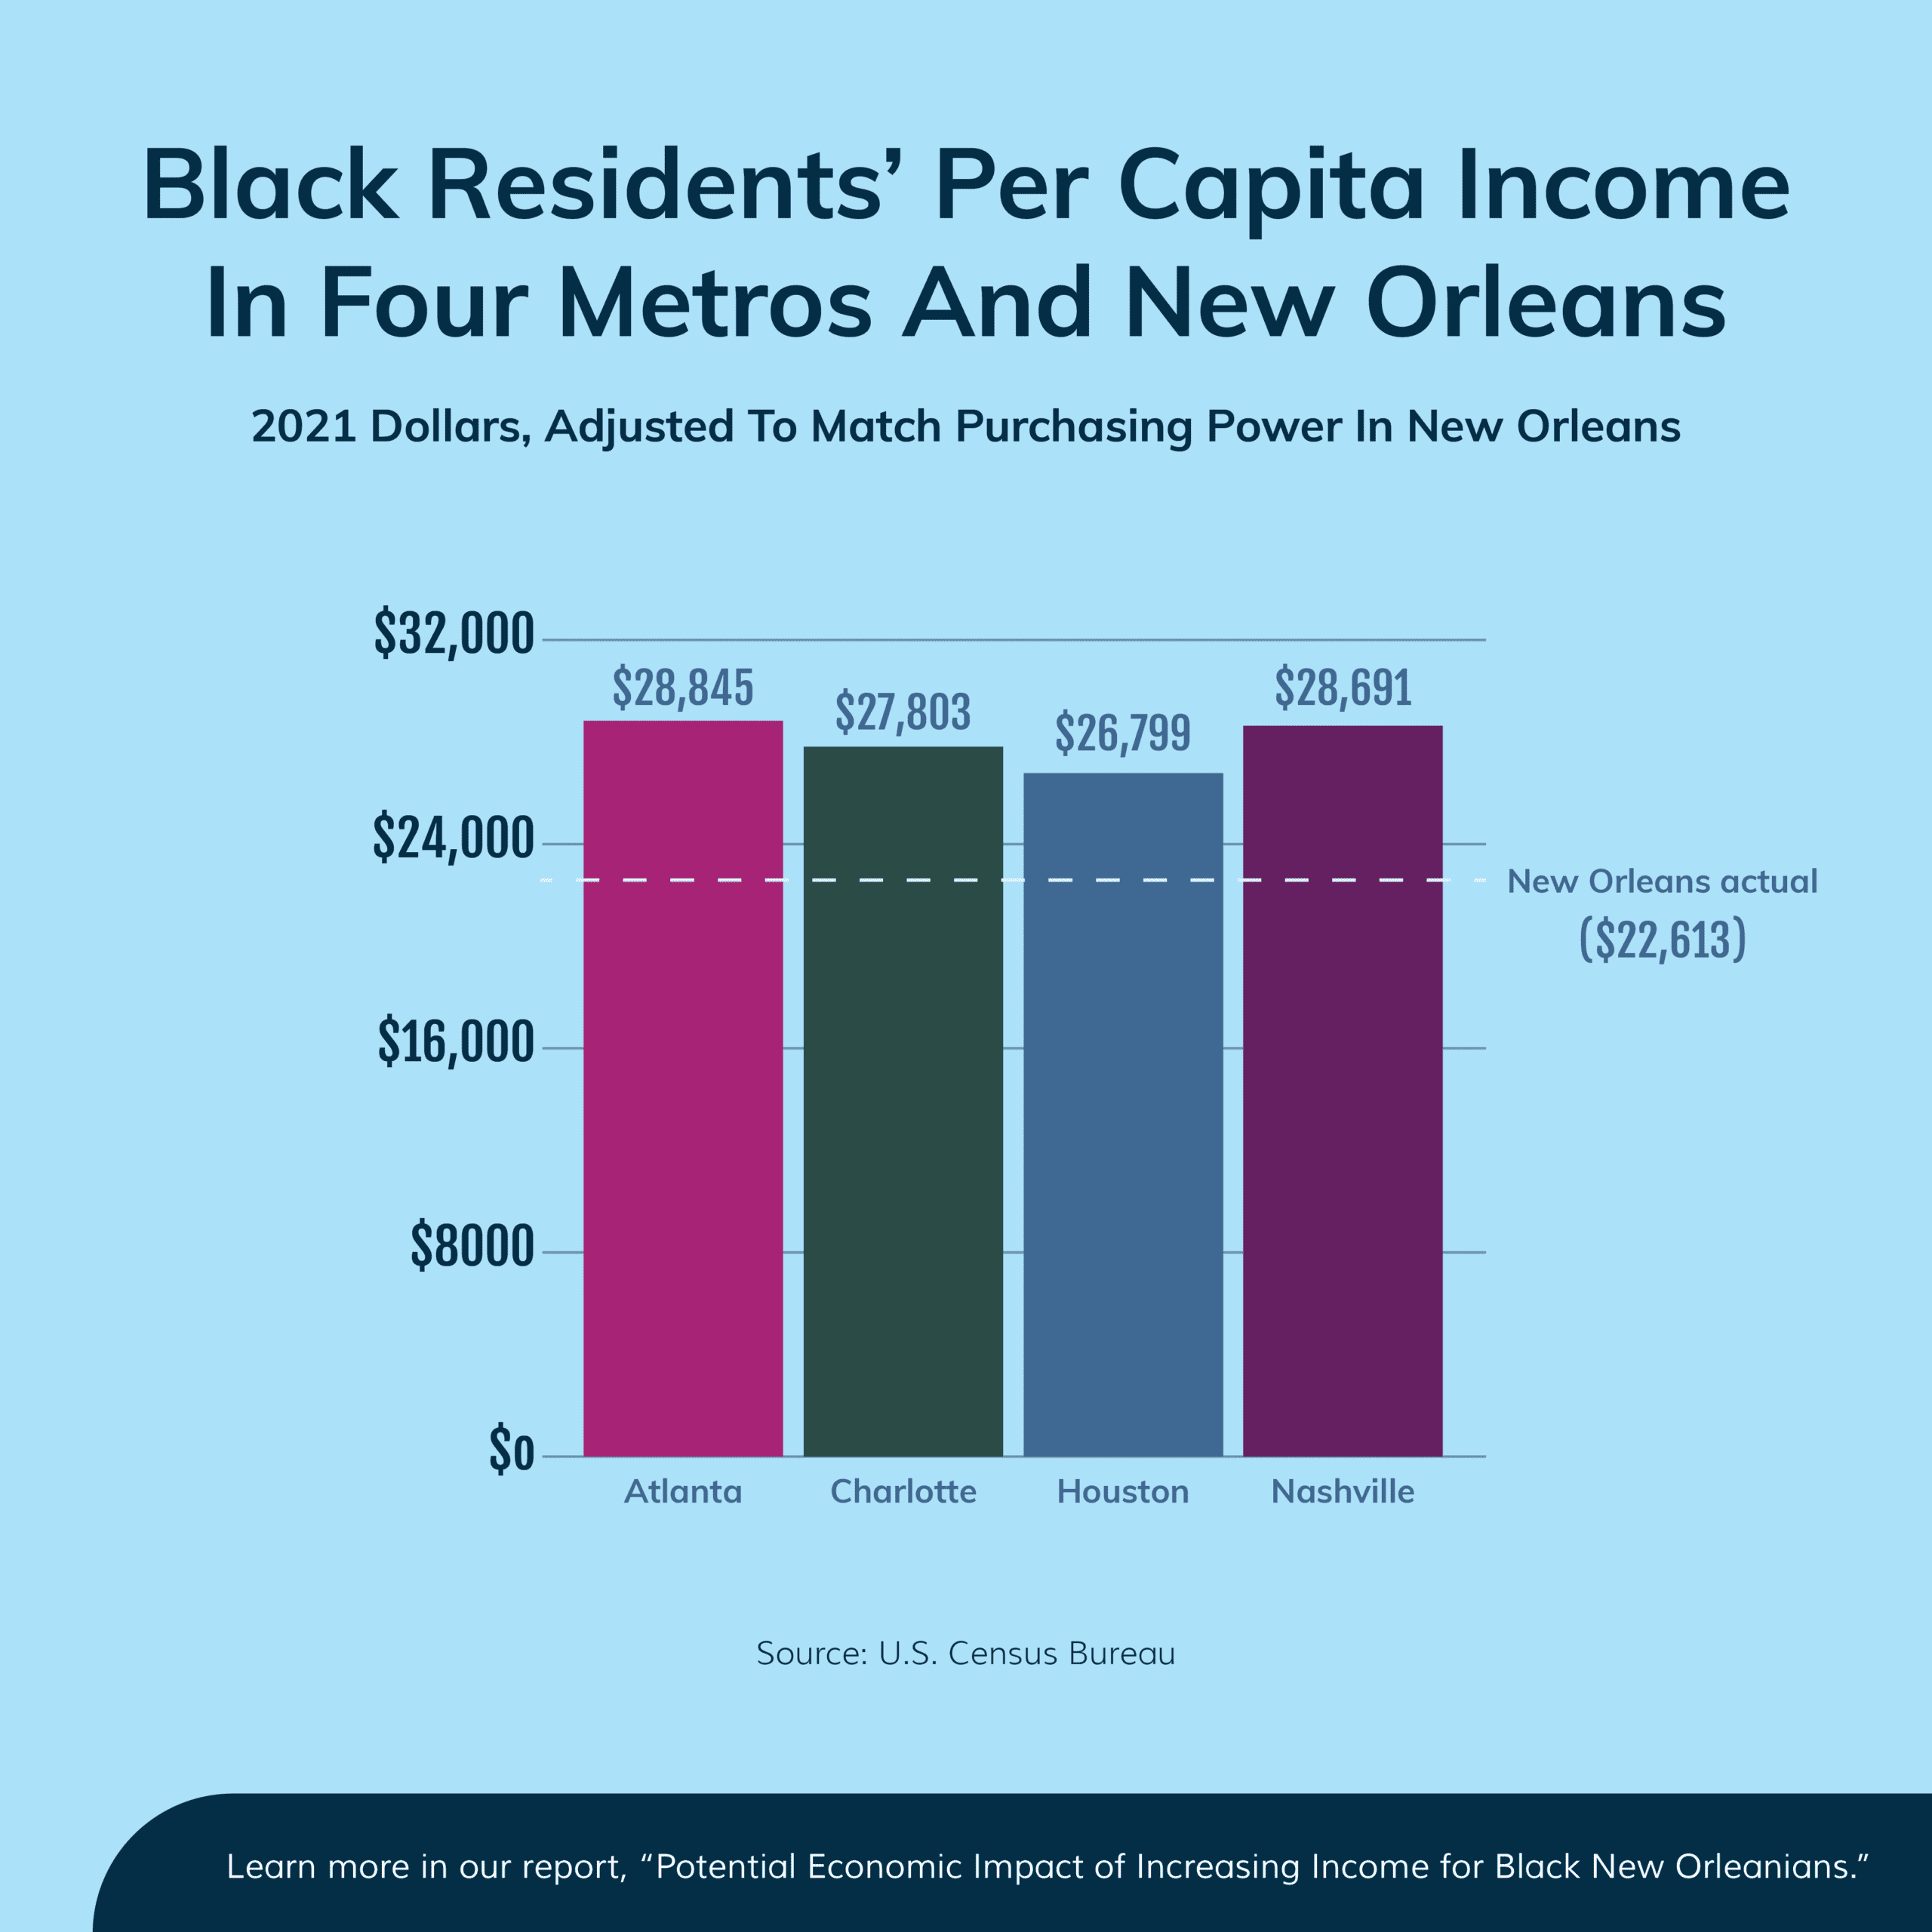
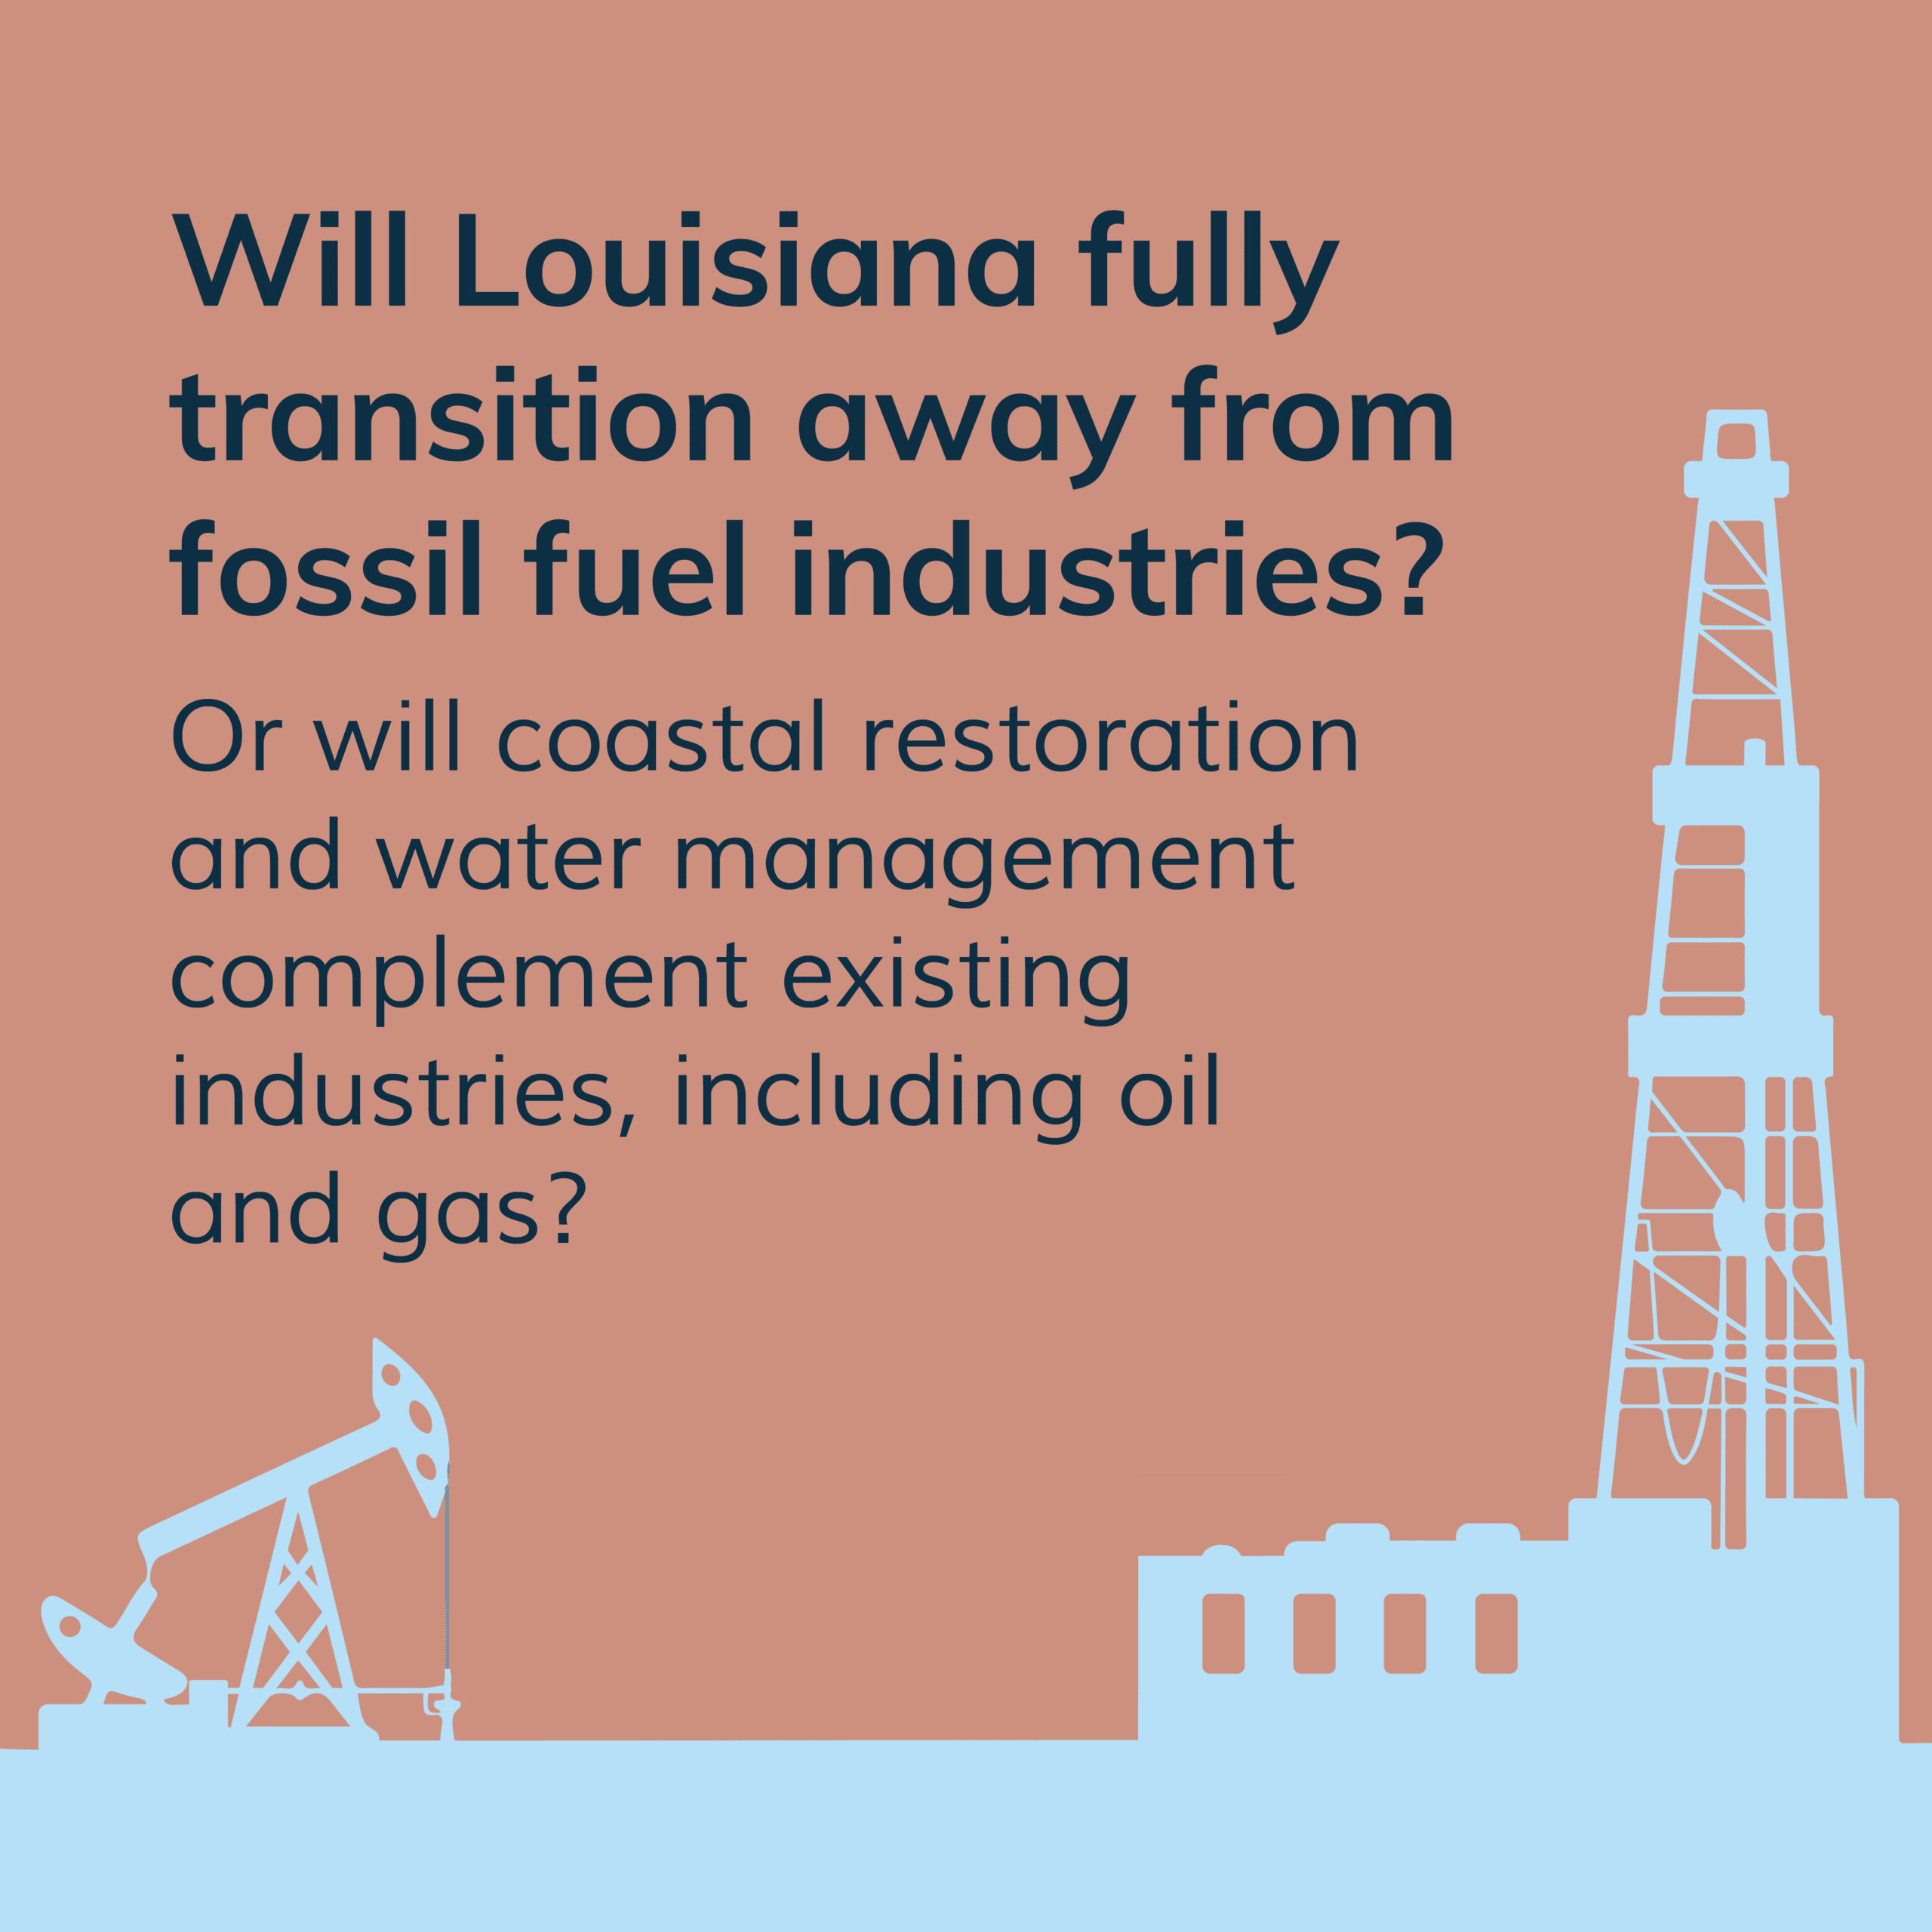
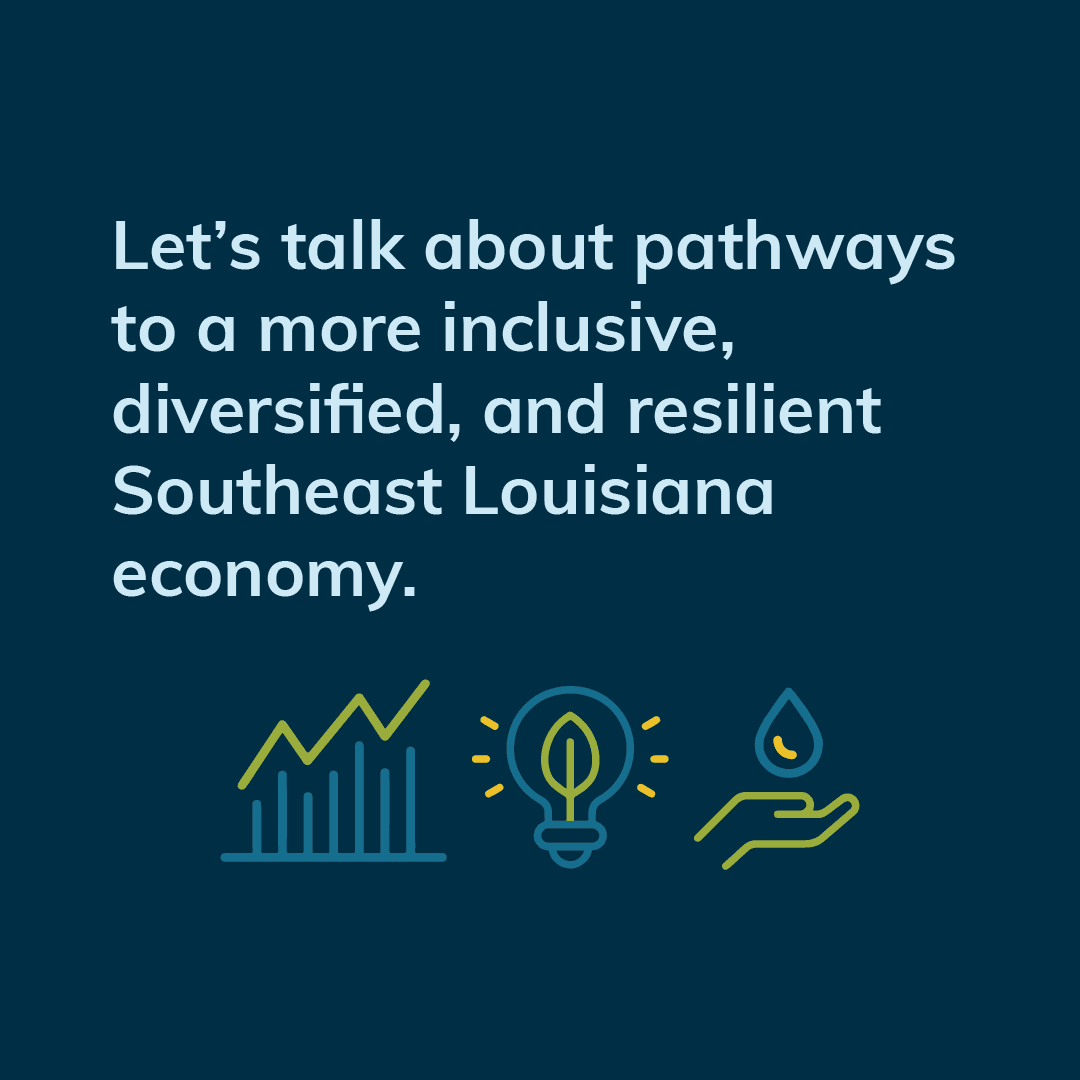
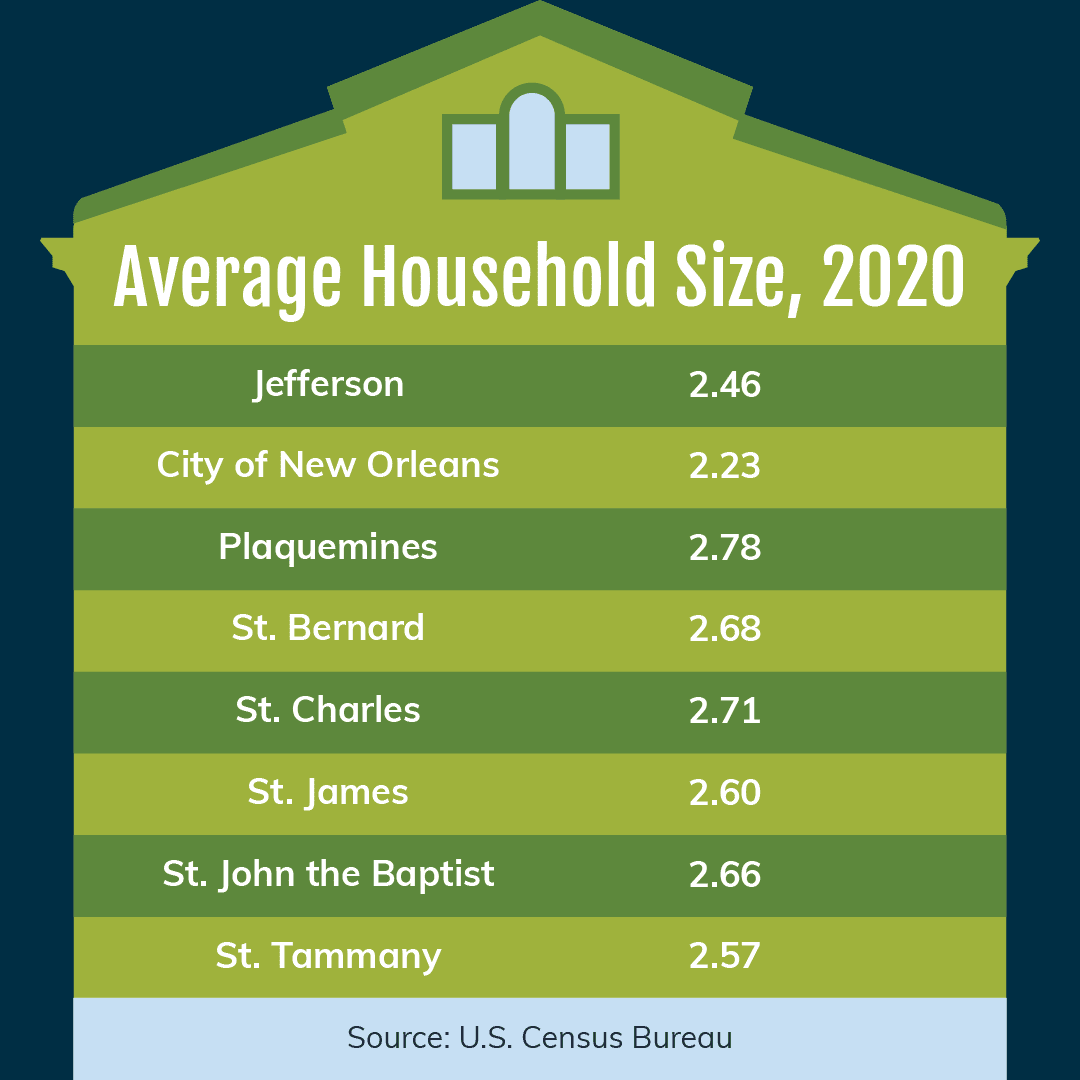
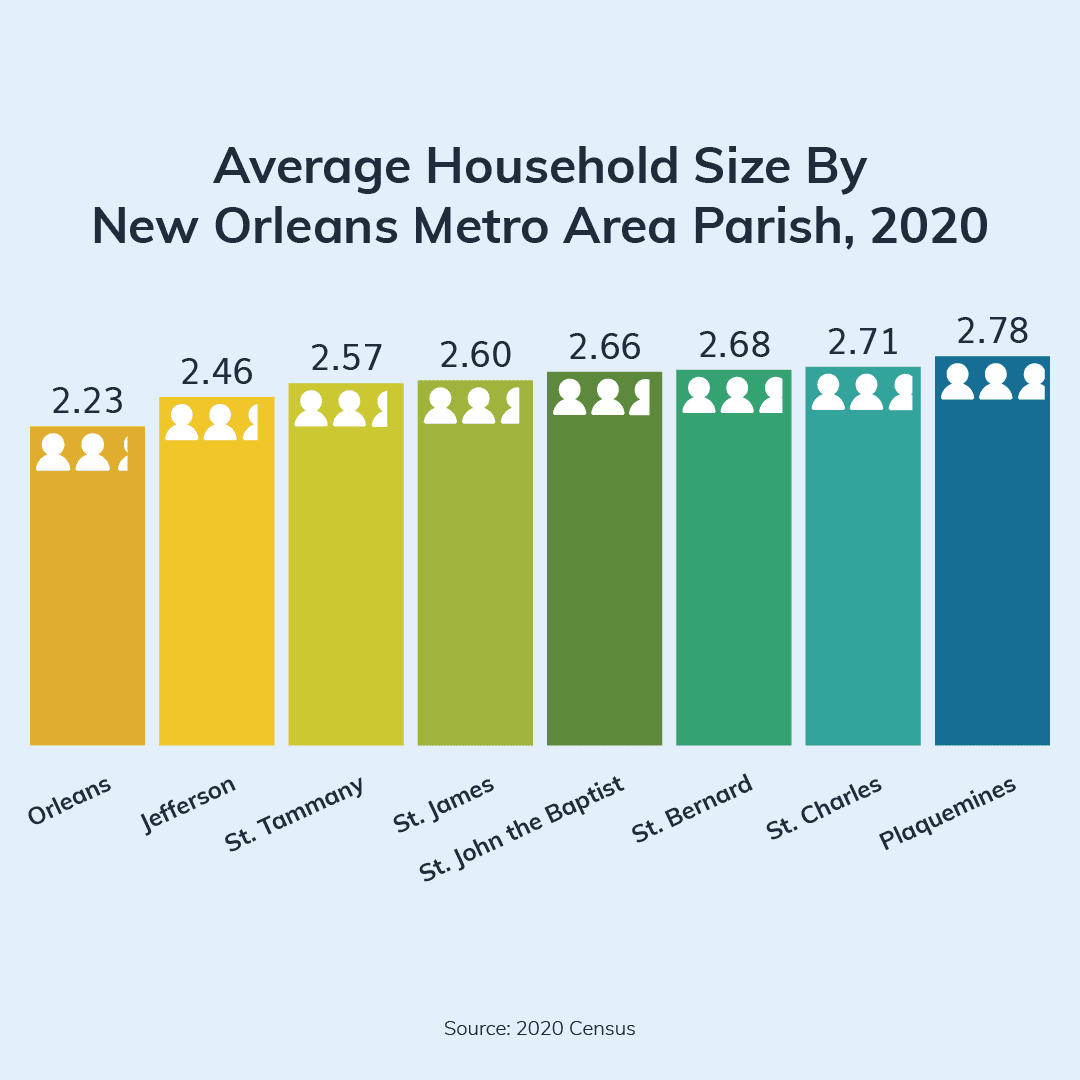
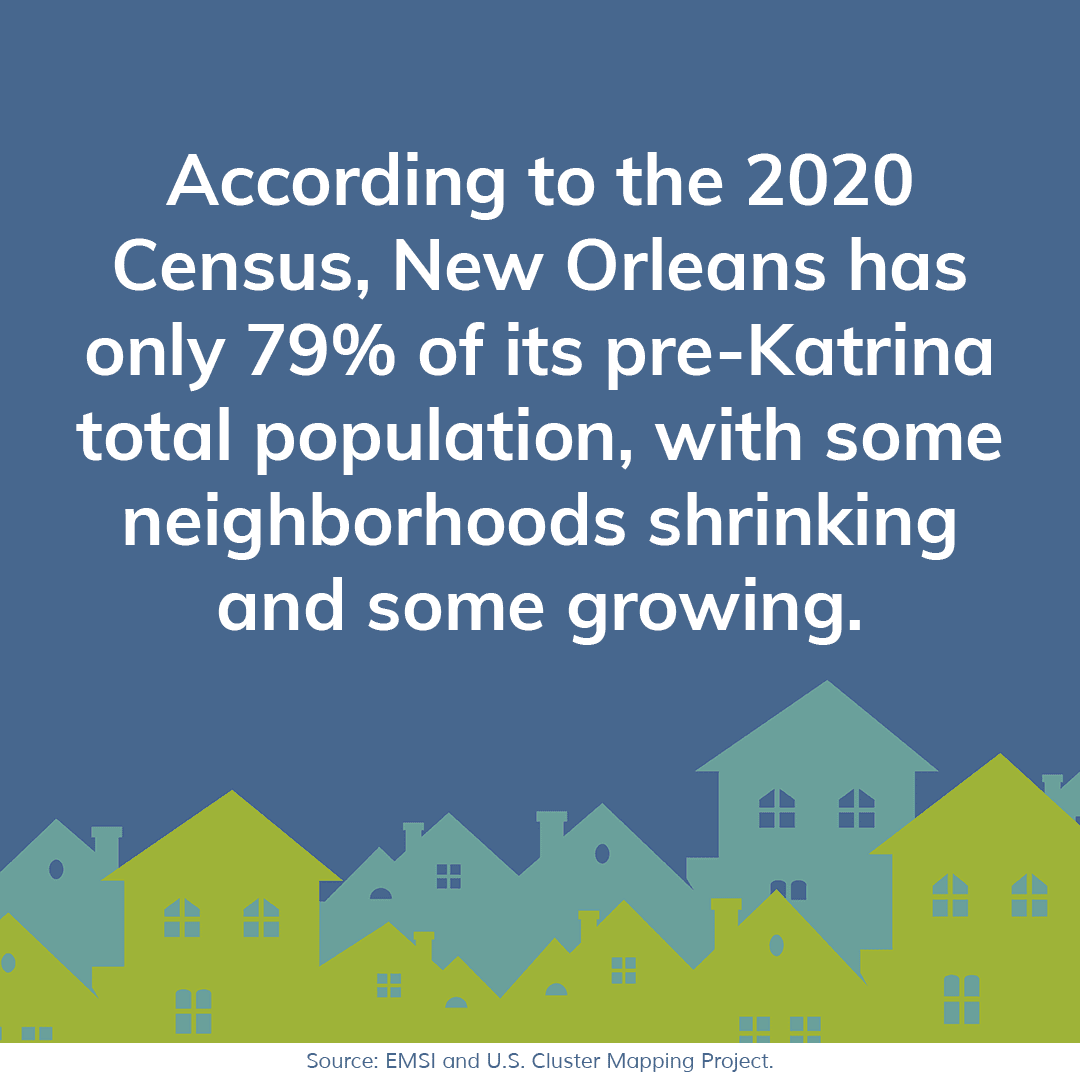
Custom Graphics
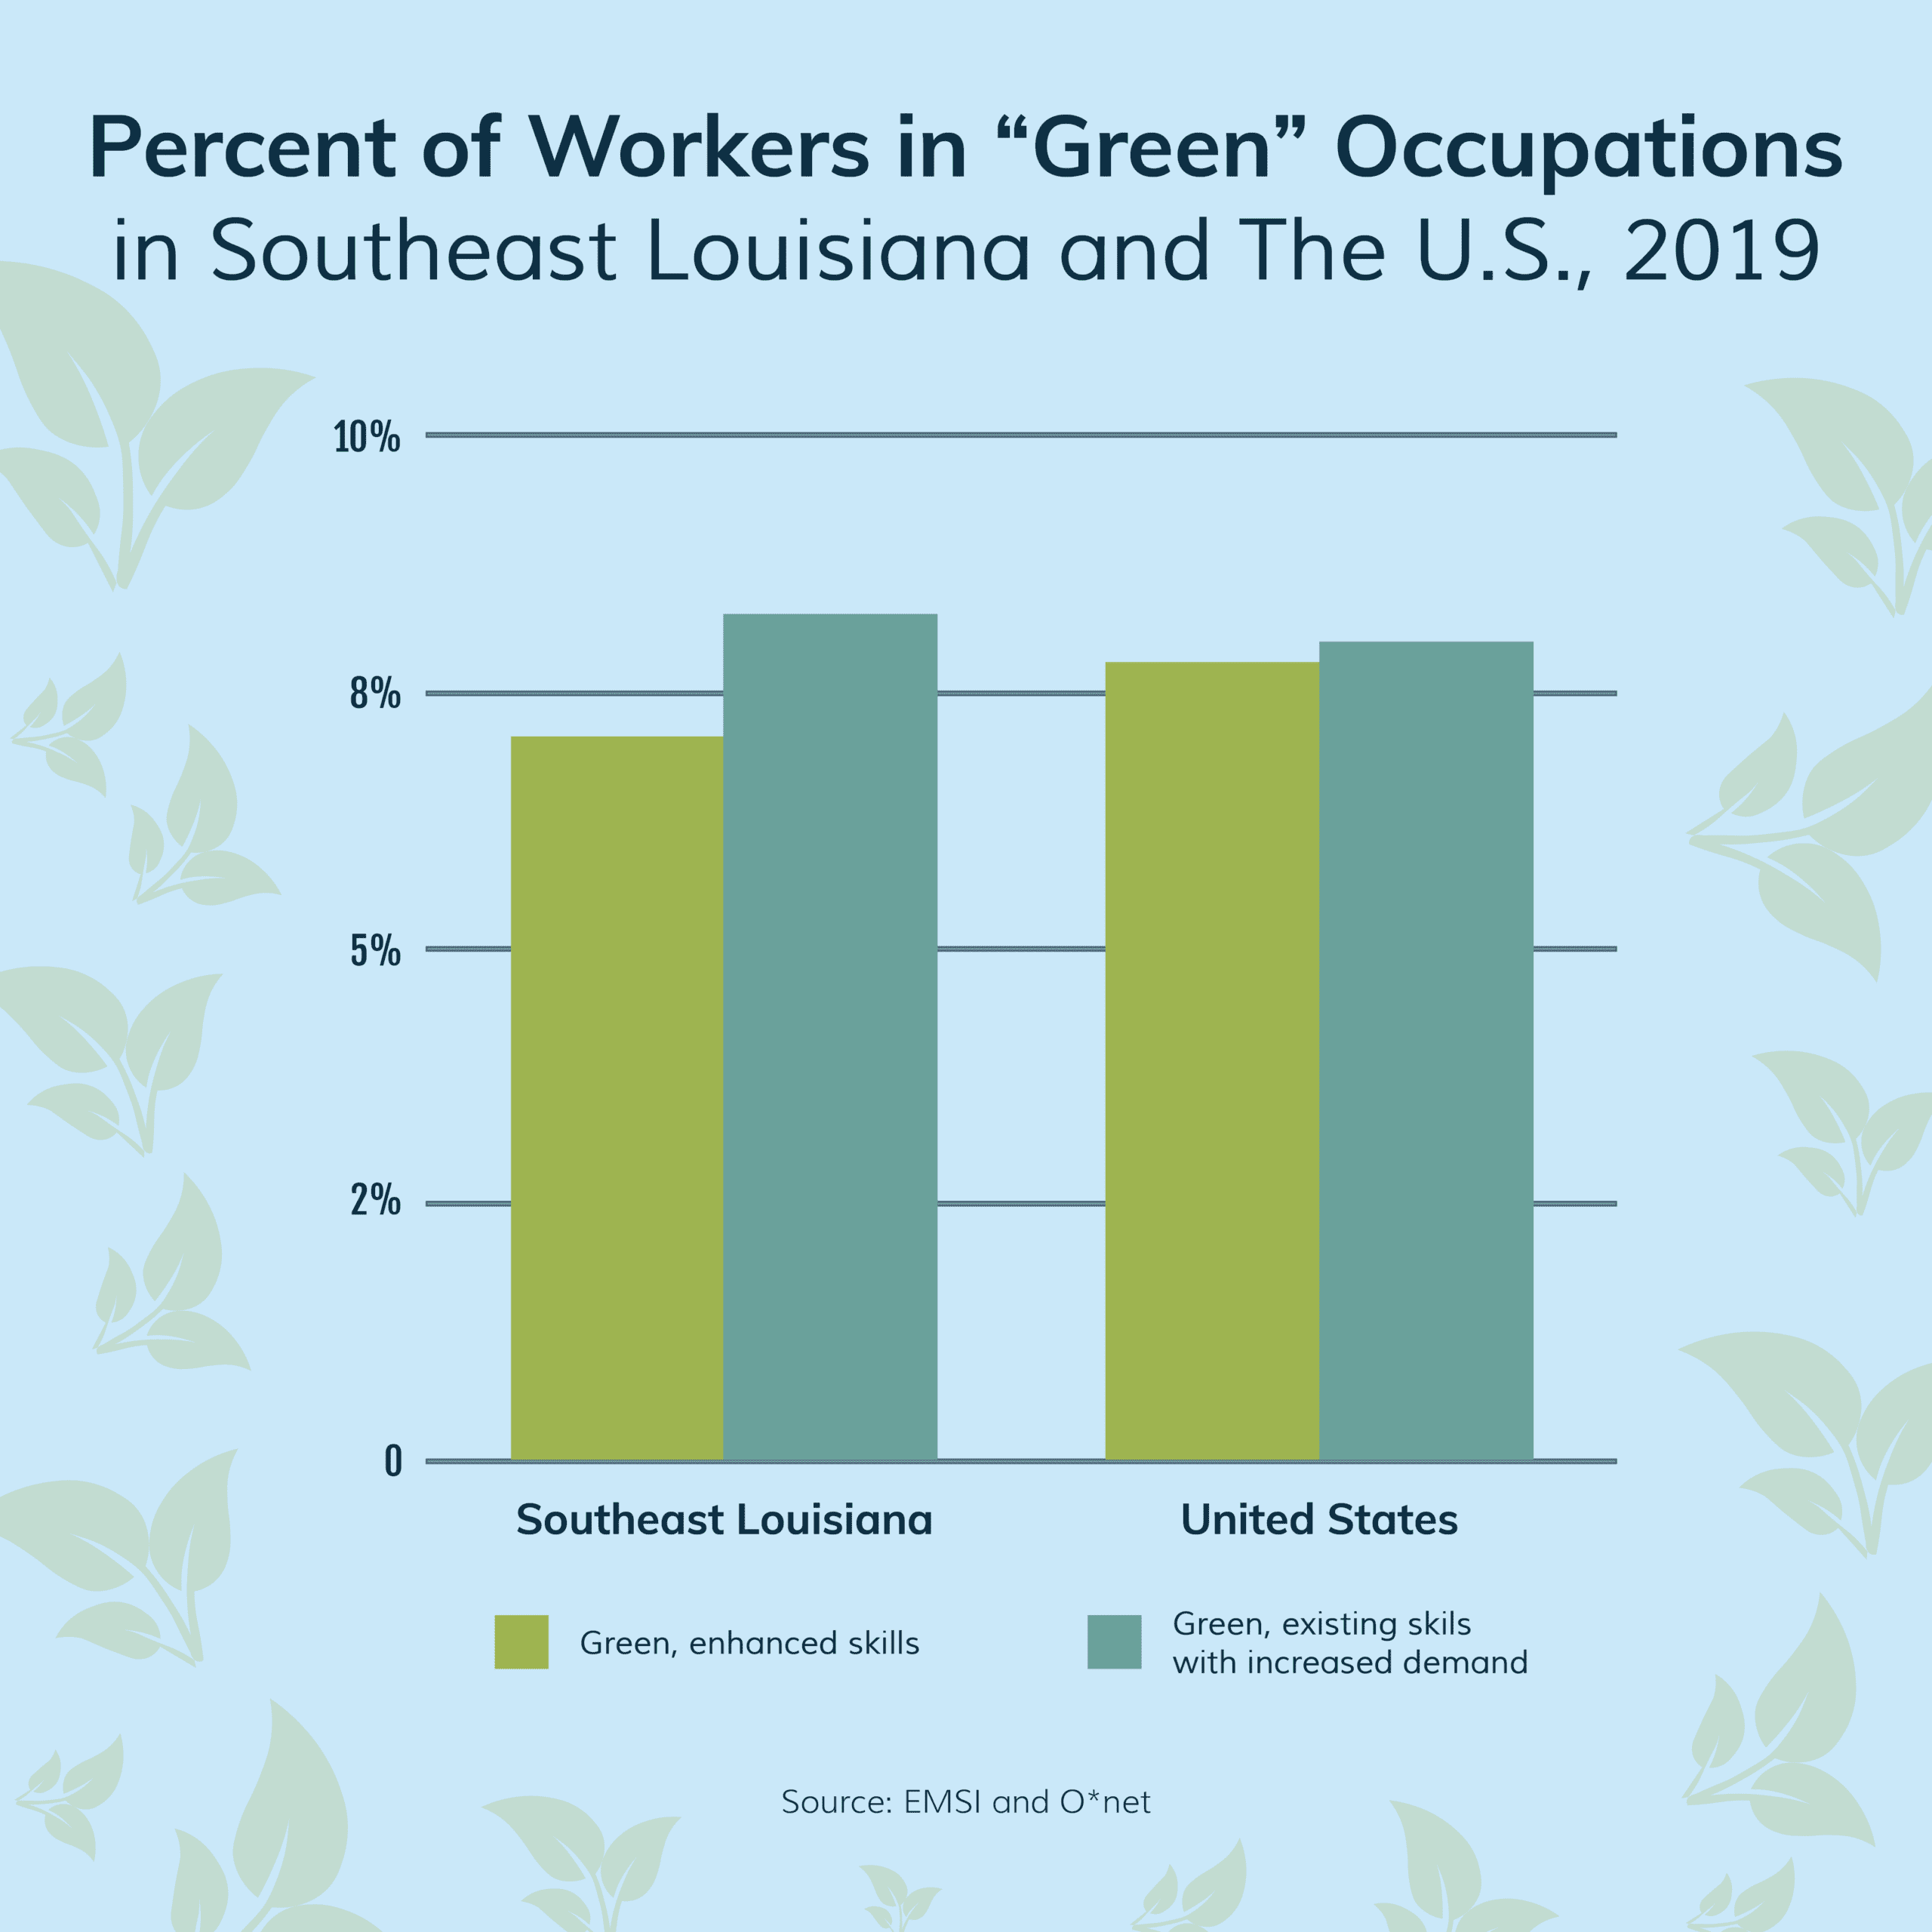
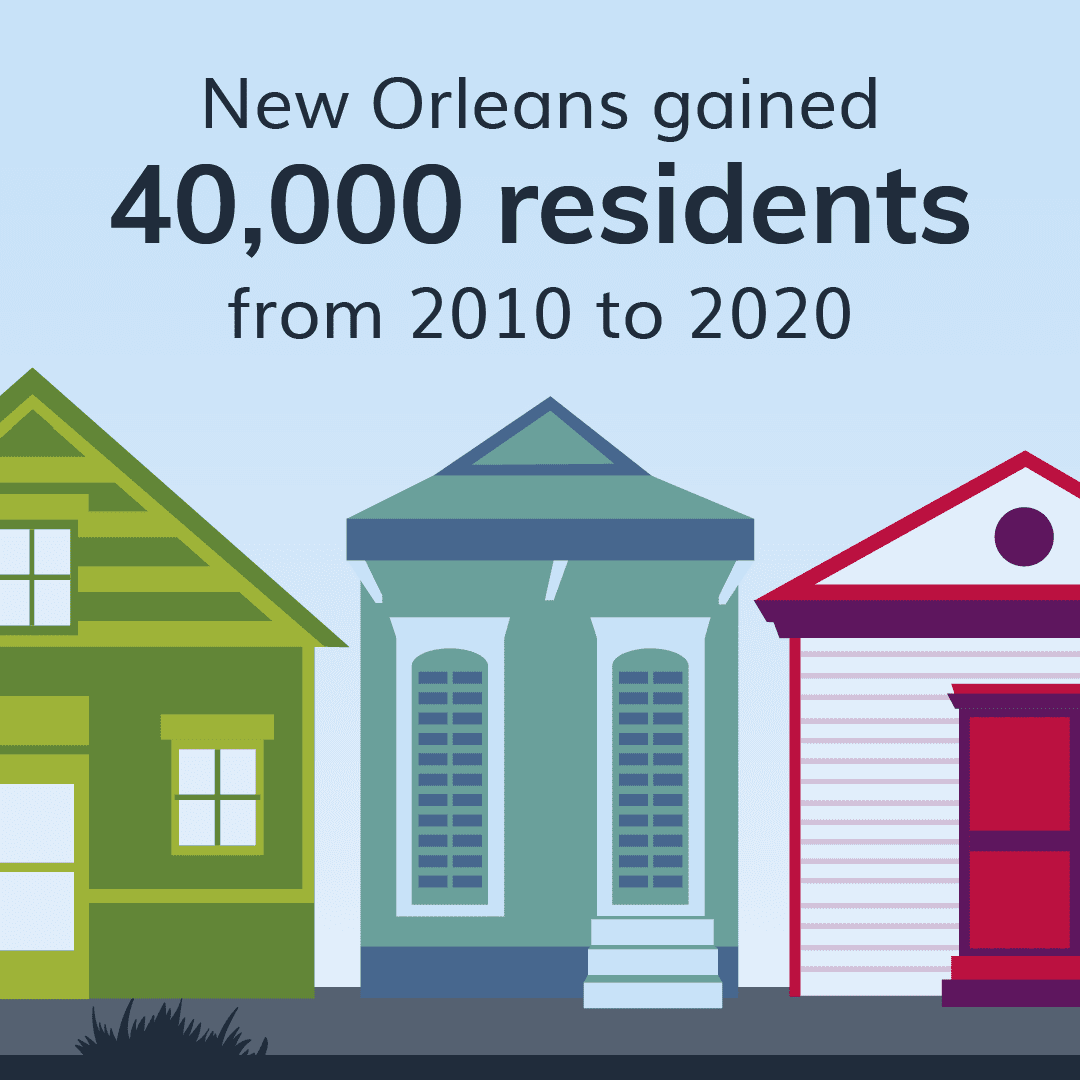
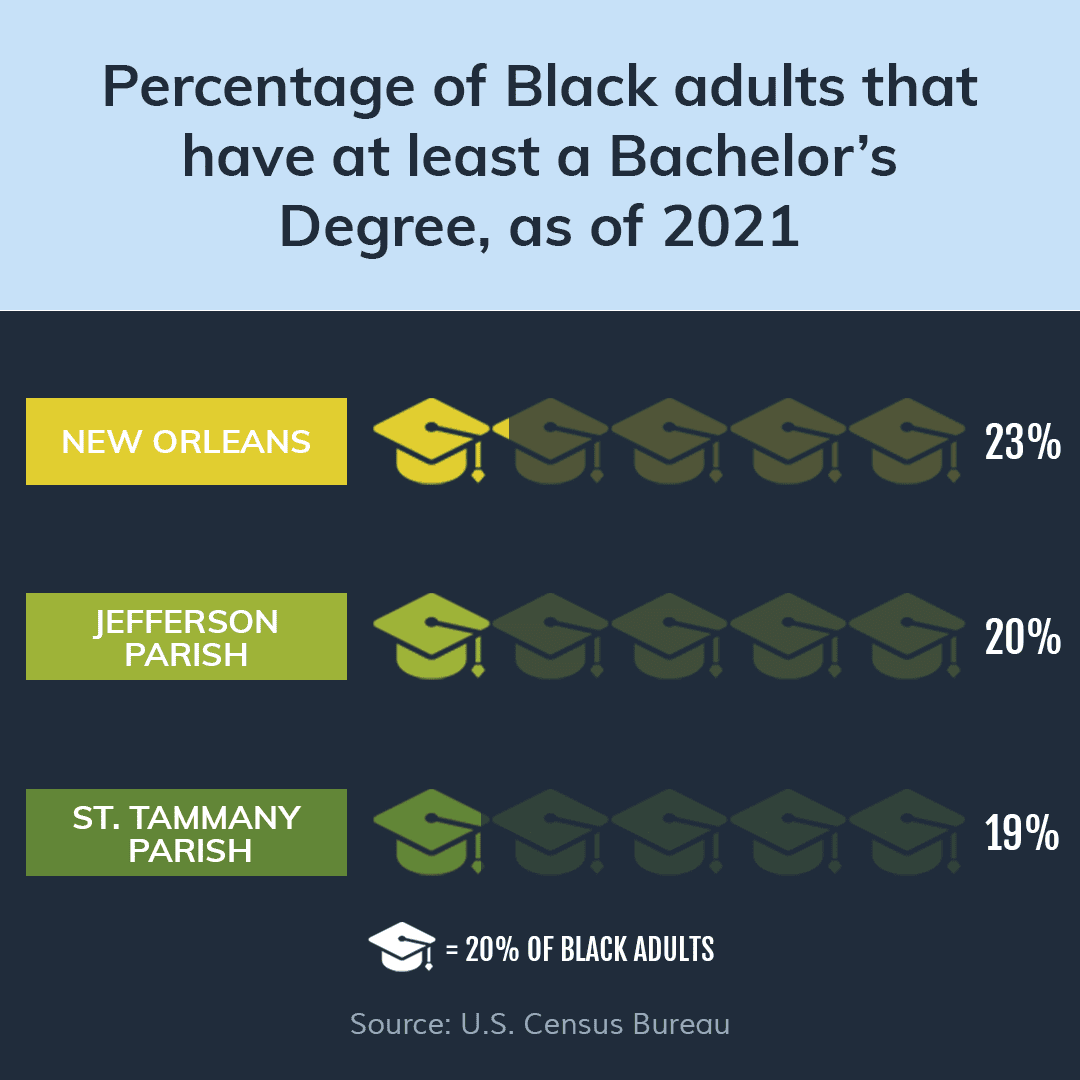
Our team created custom data visualizations and other illustrations for The Data Center to showcase their findings in a more visual, accessible way that would perform better on social media. This often involved creating charts and graphs to streamline showcasing data for a social media audience. You can see several examples of our work below:

Results
With consistent organic posting and monthly paid advertisements, stakeholder awareness and engagement grew across all platforms while driving traffic to The Data Center’s site.
From April 2016 to October 2022, Online Optimism’s work generated:
0
Impressions
0
Engagements
0
Link Clicks
0
Report Downloads
0
Site Sessions

Want Your Company to be our
Next Case Study?
"*" indicates required fields